Analytics: Turning QR Codes into business intelligence
Make every scan an ROI
Every QR code scan reveals who your customers are, where they engage, and what drives them to act. Transform physical interactions into actionable data.
85% of customer interactions are invisible to you
73% of marketing spend can't be traced to actual customers.
85% of customer interactions happen offline - but you can't see them.
€ 2.3M average annual marketing budget with no real-world visibility.
Your customers are everywhere - at events, in stores, using your products, engaging with your campaigns in the physical world. But your analytics only show you clicks and impressions.
What you're missing:
Who actually engages with your brand in real life
Where your most valuable leads discover you
Which offline campaigns drive real results
Why do some locations perform better than others
Transform offline blindspots into your competitive advantage. One platform. Every touchpoint. Complete ROI visibility.
Unitag QR Analytics: Monitor real-world engagement
Transform every real-world touchpoint into rich customer intelligence. Finally see the complete picture of your campaign performance.
What this means for your marketing
With just regular Analytics:
"Our print generated 2,000 clicks"
— But no context
"Store foot traffic is down"
— But don't know why
"Product packaging isn't working"
— Pure guesswork
With Unitag QR Analytics:
"Our print generated 2,000 leads, 65% used Apple devices, during lunch time and 80% of them are English speakers"
"Store foot traffic is down 8% during weekdays but attracts 5% more during the weekend, we can use this to improve our emailing strategy"
"Product packaging performs 3x better when paired with free recipes and educational content – let's adjust our content strategy using A/B testing learnings from our QR codes"
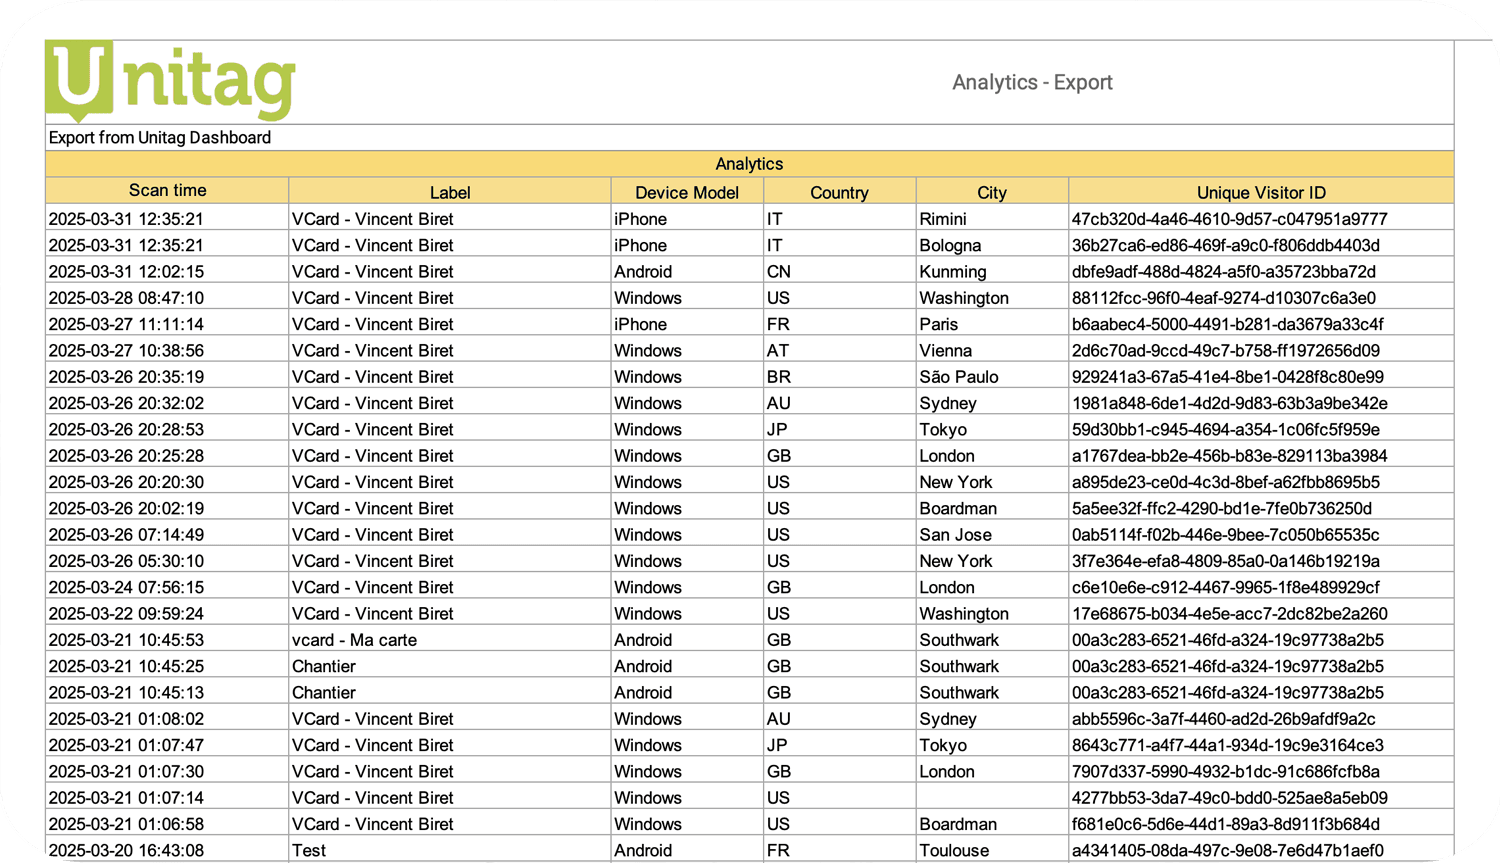
Advanced reporting through smart data segmentation
Capture multi-dimensional user insights across device preferences, geographic patterns, behavioural contexts and export detailed analytics through customisable Excel reports tailored to your specific tracking needs.
Unitag’s comprehensive reporting suite:
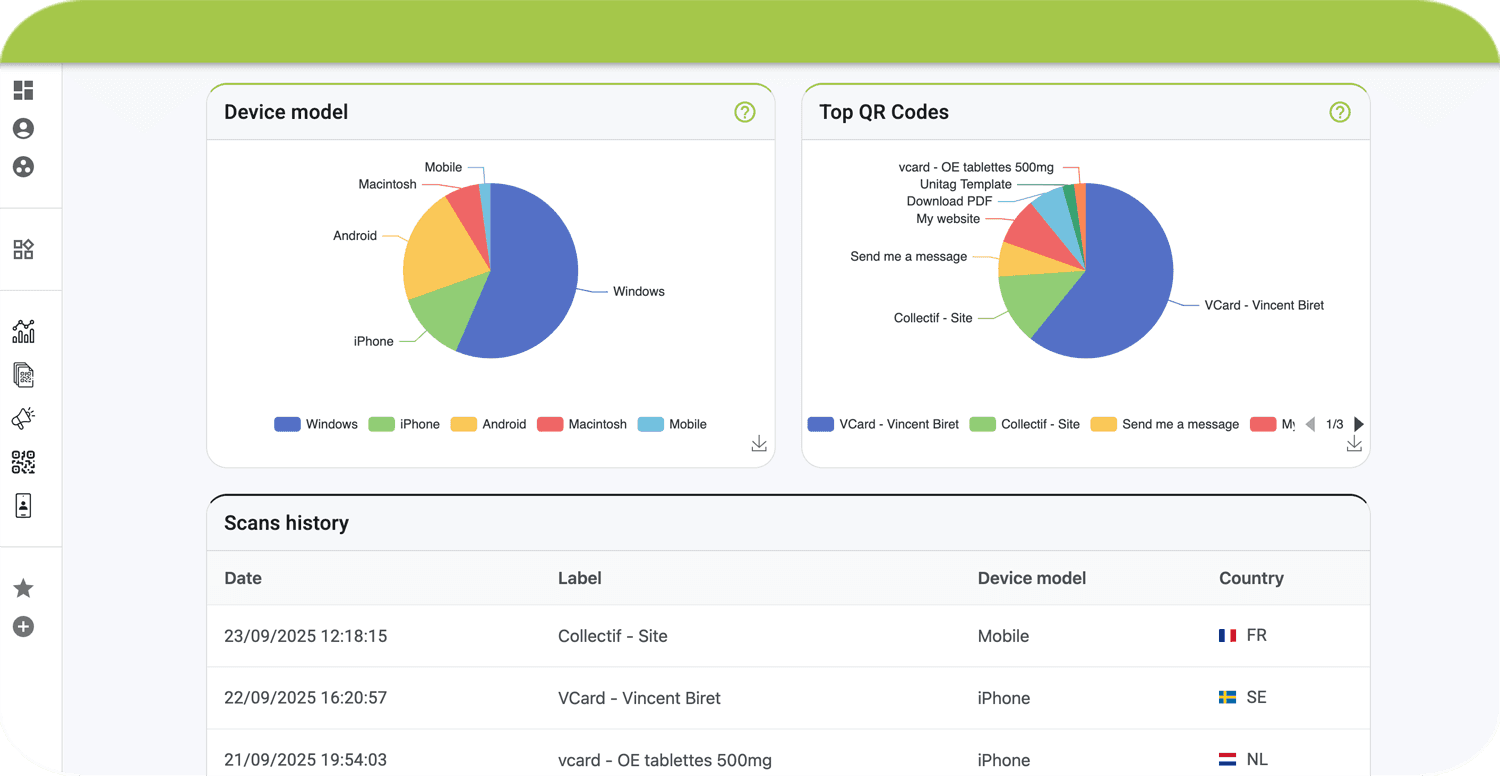
Performance overview reports
Ranking analysis of all QR codes by engagement
Campaign timeline impact with creation timestamps
Measure URL performance
Granular interaction reports
Individual scan-level data for targeted campaigns (scan by scan)
Precision timestamping down to the exact second of engagement
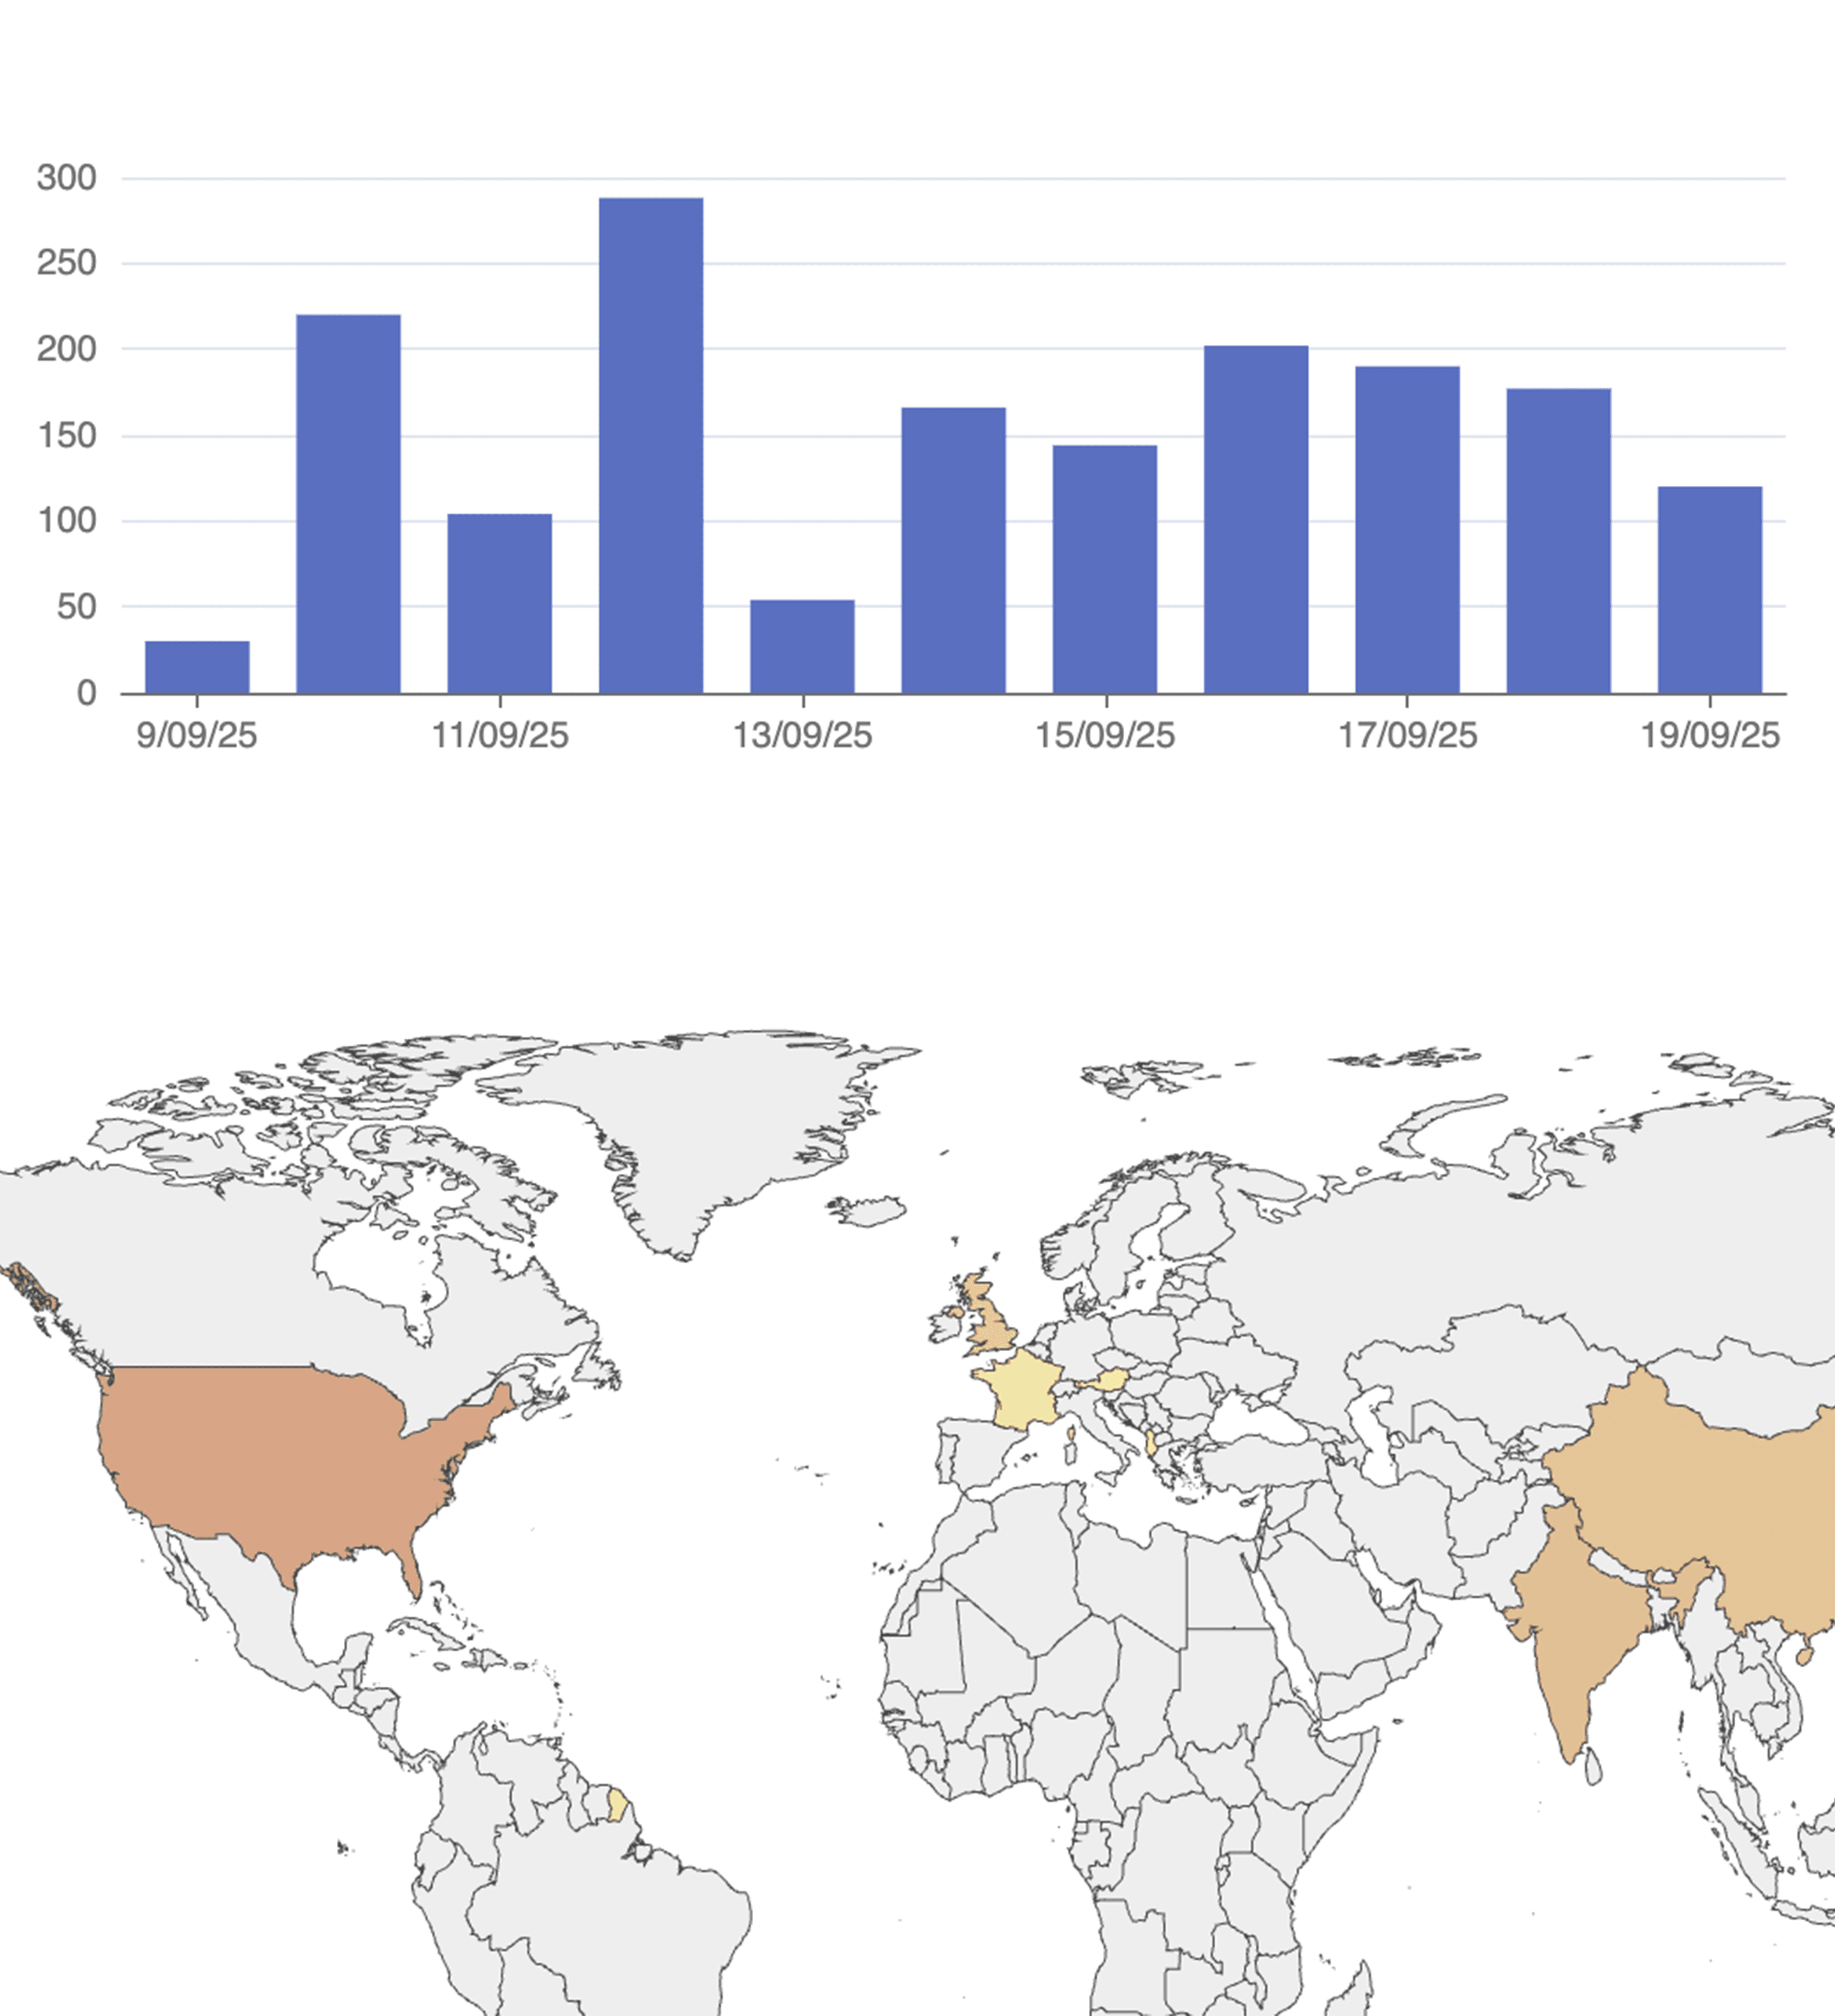
Multi-layered geographic intelligence:
Country-level demographic insights
Hyper-local city proximity mapping
Device analysis and in-depth categorisation
Understanding linguistic preferences